
Evaluating Estimators—What you can learn from the movie “Moneyball”
Editor’s Note: This is the first in a 3-part series titled “How to Develop a World Championship Team,” that examines how to evaluate estimators; part two will discuss criteria for project managers; and part three will explore how to select superintendents and foremen.
In 2002, Oakland Athletics faced a conundrum. Player salaries had ballooned to astronomical levels. Plus, large market franchises with a seemingly endless fan base, lucrative television rights and merchandise outlets—such as the New York Yankees, New York Mets and the Boston Red Sox—possessed the ability to win over signature players.
Smaller market teams had to be more frugal with their expenses and balance their payroll against lower income. In many cases, talented players that developed quickly and became media darlings in these small markets moved to the mega-franchises for their payday. Oakland qualified as one of these small markets. Lacking the financial means, the A’s had to use a non-traditional method of evaluating talent.
Billy Beane, the general manager and minority owner of Oakland, enlisted the services of Paul DePodesta, a Harvard graduate. (In the film, the character Peter Brand was created as a composite of DePodesta and Beane's deputies in Oakland.)
Baseball scouts typically relied on intuition and baseball acumen to grade talent as the talent entered the major leagues from high school or college. In most cases, these talented ball players expected higher salaries for an unproven product.
Beane, a former Major League ball player, understood how scouts gauged talent and how qualitative metrics (how a player looks on the field) received higher marks than quantitative metrics (on-base percentages).
Finding undervalued players through a statistical mechanism known as “sabermetrics”—a specialized analysis of objective and observed data gathered through in-game activity—became Beane’s hallmark. Scouts and baseball experts scoffed at Beane’s process, calling it a media gimmick. However, by finding unorthodox players that excelled largely in previously unheard of statistical categories, Beane created franchise gold—winners on the field and on the income statement.
The construction industry today deals with a similar challenge to what Beane faced: finding good talent. The supply of contractors greatly exceeds the demand of construction projects. Even in a recessionary market, contractors struggle to find capable estimators, managers, superintendents and foremen to enhance margins, reduce risks and preserve their bottom line.
I often hear the following statements: “We’re looking for strong estimators and managers,” “We need managers that can make money,” and “We need field managers that have a ‘can-do’ attitude.” This need can be compared to a general manager of a baseball team looking for a shortstop with hustle and a right fielder with a “gun.”
Business owners need a way to evaluate construction professionals based on specific criteria that correlates to enhancing margin, improving productivity and hedging construction risks.
Finding and evaluating the right data can be difficult. Much like the 2002 Oakland A’s, construction firms face the challenge of finding the right variables to the successful profitability equation.
A Flawed Metric
Construction executives typically benchmark estimating talent to bid-hit ratio—the higher the hit ratio, the greater the success. Common wisdom would indicate that without work, money cannot be made. However, contractors tally these supposed “wins” on bid day rather than at their conclusion.
This is similar to determining the winner of any game at the end of an inning, quarter or period rather than at the final whistle. Beane viewed batting averages as a weak metric to base a player’s contribution to wins and losses. A player may exhibit a strong hitting ability, but this does not necessarily translate to runs. Instead, Beane used non-traditional metrics, such as the on-base percentage and slugging percentage. Ultimately, runs translate to winning.
Business owners should not base estimating success simply on jobs awarded. In the end, jobs must translate to bottom-line profitability. Hit ratio and profitability do not necessarily relate to each other.
A contractor low on bid day does not mean he or she will achieve the desirable margins. However, a company that emphasizes the importance of a high hit ratio will normally see the hit ratios increase, often at the expense of profitability.
Effective Evaluation method
Estimators should be evaluated on their accuracy. Consider the following analysis of an estimator’s performance in Figure 1.
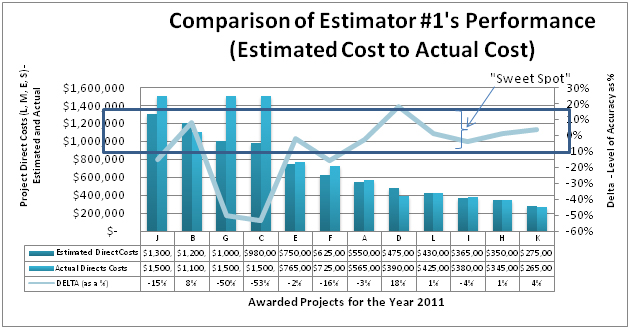
The example in Figure 1 (page 15) examines Estimator #1’s portfolio of awarded projects by overall accuracy (estimated costs compared to actual costs) and the relative labor expenditure on said projects. A pattern quickly emerges for projects sorted according to size. As the project size decreases, Estimator #1’s overall accuracy improves.
Within Figure 1, this estimator’s “sweet spot”—and variance of +/- 10 percent—is best demonstrated on projects in which the labor costs do not exceed approximately $500,000.
Also, Estimator #1’s overall accuracy is -14 percent based on this year’s data set. From a different perspective, Estimator #1’s projects will likely experience some sort of margin erosion based on this predictive index. On the other hand, it would be equally concerning to see an estimator with a positive variance. While this company will likely improve its labor budget, they will most likely lose work due to estimated cost inflation.
The next step in the analysis is to examine the entire pool of estimators, and determine overall group accuracy. Figure 2 below examines an entire estimating department’s accuracy.
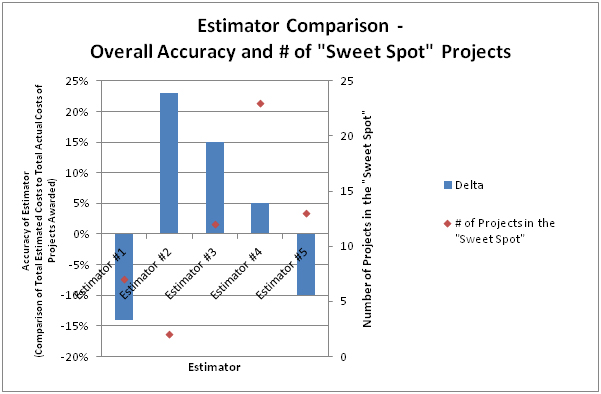
Estimator #4 is the most accurate estimator within this firm. In addition to a high accuracy score, this person also has the highest number of projects that fit within the acceptable range.
Examining Profitability
The last element to examine is overall profitability. Figure 3 compares the metrics of hit ratio, accuracy and final project profitability.
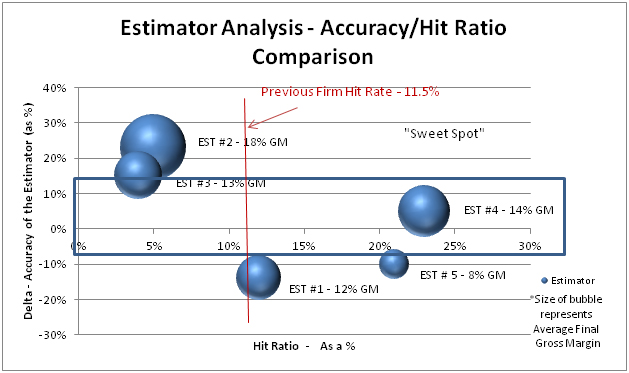
Based on the traditional metric of bid-hit ratio, Estimator #4 and #5 both exhibit strong hit ratios. However, Estimator #5 is not only less profitable but also demonstrates a negative accuracy, most likely causing the lower overall profitability. Estimator #1, who demonstrates an 18 percent gross margin, has one of the worst accuracy ratings and a low hit ratio as a result.
Metrics and analyses such as these shed light on important strengths and deficiencies within a company. They also provide data points that require further learning and clarification. For example, certain actions resulting from this analysis may include:
Replicable Systems - What processes, systems or knowledge does Estimator #4 have that the balance of his/her estimating team lack?
Training - What training would improve the collective group accuracy?
Sustainability - As markets continue to evolve, will Estimator #4’s success be sustainable, or is it just an anomaly brought about by a niche, customer or timing?
Try This
Follow these guidelines when evaluating estimators:
Estimators should be evaluated on their accuracy (estimated costs compared to actual costs) and the relative labor expenditure on said projects. The example in Figure 1 (page 15) examines Estimator #1’s portfolio of awarded projects by overall accuracy.
Examine the entire pool of estimators, and determine overall group accuracy. Figure 2 examines an entire estimating department’s accuracy.
The last element to examine is overall profitability. Figure 3 on page 17 compares the metrics of hit ratio, accuracy and final project profitability.
Business owners should not base estimating success simply on jobs awarded. In the end, jobs must translate to bottom-line profitability.